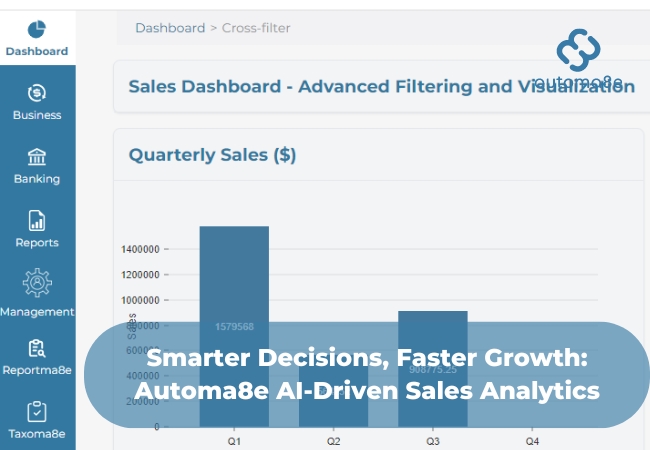
In today’s competitive business landscape, data is one of the most valuable assets a company possesses. However, despite having access to an abundance of data, many businesses struggle to turn that information into actionable insights. Automa8e AI-Powered Sales Analytics Dashboard is designed to address these challenges, offering powerful features that go beyond traditional reporting.
In this blog post, we’ll dive deep into the common Issues businesses face when dealing with sales analytics and explain how Automa8e dashboard is specifically built to solve these issues. By providing advanced filtering, visualization, AI-generated insights, and instant downloadable reports, Automa8e transforms the way businesses interact with their data, helping them make smarter decisions and drive growth.
Key Features of the Automa8e Sales Analytics Dashboard
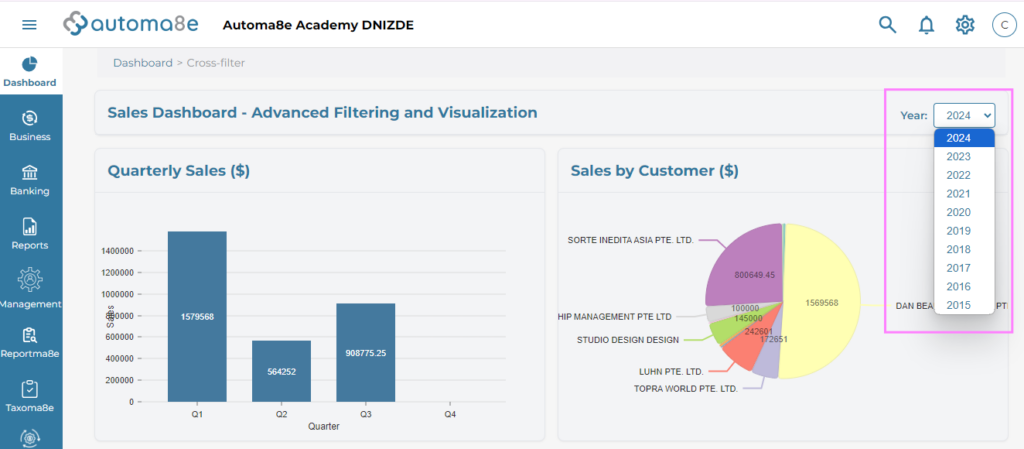
1. Yearly Data Analysis
Businesses need the flexibility to examine their sales data across different timeframes. Whether you’re comparing sales performance over several years or drilling down into the most recent figures, Automa8e makes it easy to select and analyze data for any year.
Challenge:
Many businesses lack the ability to easily access historical data or compare year-over-year performance. This can make it difficult to identify long-term trends or understand how past decisions have impacted the company.
Automa8e Solution:
With Automa8e, you can analyze data from any year, giving you a comprehensive view of your business’s performance over time. This feature helps businesses identify patterns, seasonal fluctuations, and trends, all of which are essential for long-term planning and strategy development.
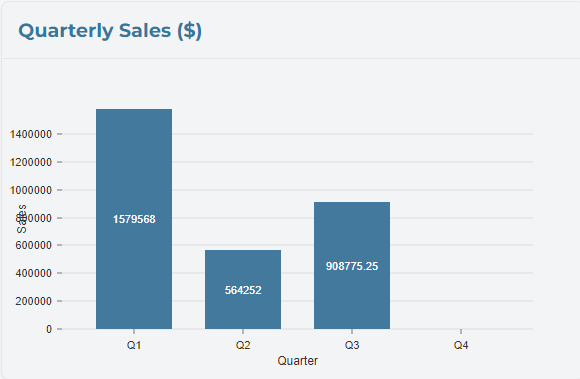
2. Quarterly Sales Breakdown ($)
Sales performance often fluctuates throughout the year, making it critical to understand how each quarter contributes to your overall success. Automa8e allows you to break down sales data by quarter, giving you a clear picture of how different time periods affect your revenue.
Challenge:
Many businesses struggle with uneven sales cycles, where certain quarters outperform others. Without proper visibility into quarterly data, companies can miss opportunities to address slow periods or capitalize on seasonal trends.
Automa8e Solution:
Automa8e’s dashboard provides a clear visualization of sales across all quarters, enabling businesses to easily identify peaks and troughs in performance. This helps companies plan for off-seasons, schedule promotions, and allocate resources more effectively throughout the year.
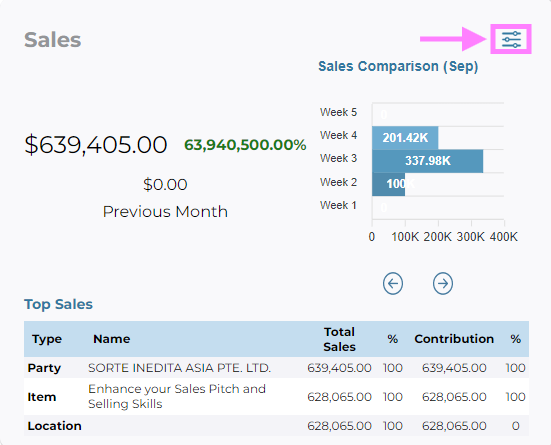
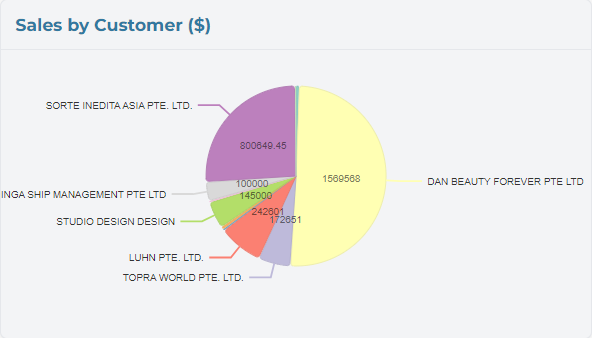
3. Sales by Customer ($)
Understanding which customers are driving the most revenue is essential for any business. Automa8e allows you to break down sales by individual customers, giving you insights into their purchasing behavior and helping you identify your top buyers.
Challenge:
Businesses often lack clarity around their most valuable customers. Without knowing who your top buyers are, it’s difficult to tailor marketing strategies, offer personalized incentives, or strengthen customer loyalty.
Automa8e Solution:
Automa8e provides a clear view of sales data by customer, helping you identify high-value clients and those who may need more engagement. With this data, you can build personalized marketing campaigns, offer targeted discounts, and nurture customer relationships to drive continued loyalty and sales growth.
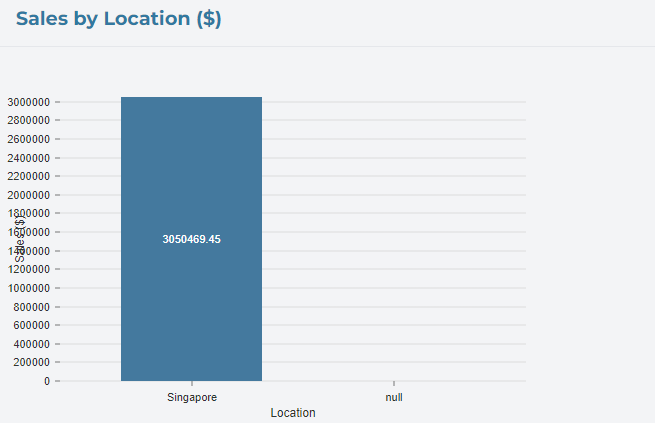
4. Sales by Location ($)
For businesses operating across multiple regions or markets, it’s critical to understand how geography impacts sales. Automa8e’s dashboard breaks down sales data by location, allowing you to pinpoint where your business is thriving and where there may be room for improvement.
Challenge:
Geographical sales data can be difficult to track and analyze, especially for businesses that operate across different regions. Without this insight, businesses can miss opportunities to expand or may struggle to understand why certain areas underperform.
Automa8e Solution:
With Automa8e, you can analyze sales by location, giving you a geographic snapshot of your business’s performance. This allows you to optimize your sales strategies for different regions, improve marketing efforts in underperforming areas, and identify new markets for expansion.
5. Items Sold (Units)
Understanding how many units of each item are being sold is crucial for effective inventory management and marketing strategies. Automa8e’s dashboard provides insights into the exact number of units sold for each product, helping you track demand and adjust inventory levels accordingly.
Challenge:
Many businesses struggle with managing inventory effectively, often ordering too much of slow-moving items or not enough of high-demand products. This can lead to wasted resources, lost sales, and unhappy customers.
Automa8e Solution:
Automa8e’s item sales tracking allows you to monitor which products are selling well and which are underperforming. With this information, you can optimize your inventory, adjust marketing strategies for low-demand items, and make data-driven decisions about product offerings.
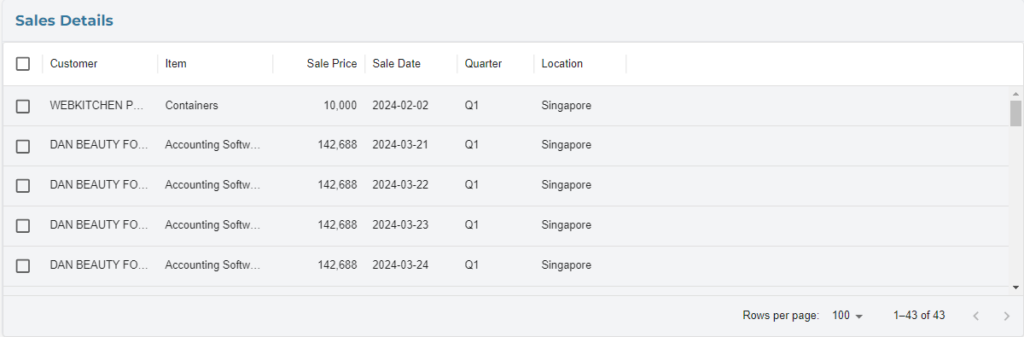
Sales Details Breakdown
One of the most powerful features of Automa8e’s Sales Analytics Dashboard is the Sales Details Table, which offers an organized, detailed breakdown of your sales data. You can easily sort and analyze data by the following key metrics:
- Customer: View sales data sorted by individual customers to track their contributions to overall revenue.
- Item: See which products are driving the most sales and which may need more focus.
- Sale Price: Monitor pricing strategies and understand how price adjustments affect sales.
- Sale Date: Identify when sales are peaking or declining to uncover seasonality or timing issues.
- Quarter: Analyze how different quarters are contributing to business growth and plan for future trends.
- Location: Gain insight into geographical sales patterns and optimize strategies for various regions.
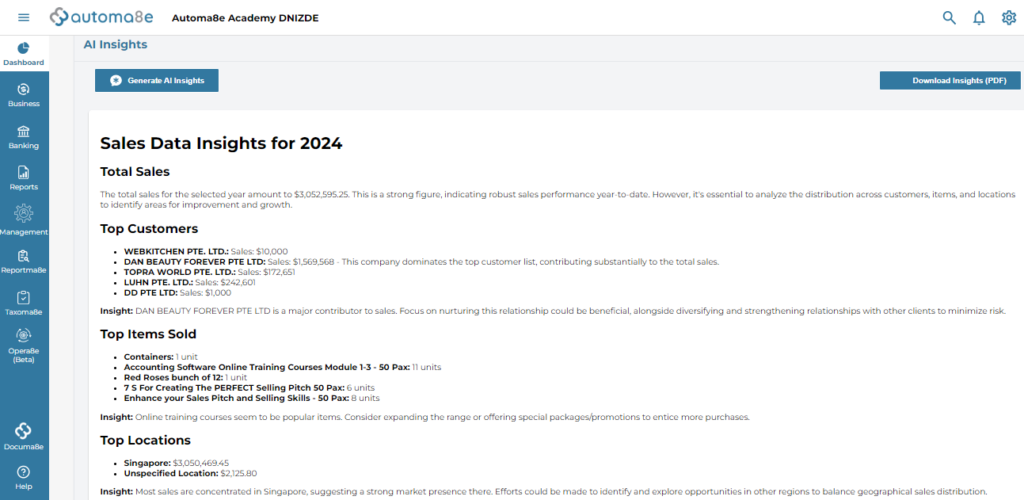
AI-Generated Insights: A Game-Changer for Businesses
While detailed sales breakdowns are important, Automa8e goes beyond traditional reporting by offering AI-generated insights that help you make data-driven decisions. With AI, the dashboard analyzes your sales data and provides actionable recommendations tailored to your business.
Pain Point: Lack of Actionable Insights
Many businesses collect vast amounts of data, but they often struggle to turn that data into actionable insights. Raw data without context can be overwhelming, and many companies lack the resources to analyze it effectively.
Automa8e Solution: AI-Powered Recommendations
Automa8e’s AI doesn’t just show you the data—it tells you what to do with it. For example, based on your sales data, the AI might generate insights like:
- Key Customers Analysis: Identify your top customers and whether they are active or inactive. If a previously high-value customer has become inactive, the AI can recommend re-engagement strategies.
- Top-Selling Items: See which products are performing best and whether there are opportunities for upselling or cross-selling. The AI might suggest promoting complementary products to boost sales.
- Geographical Insights: Analyze which locations are contributing the most to your revenue and where there are opportunities for growth. The AI might recommend focusing on marketing efforts in underperforming regions.
- Quarterly Sales Trends: The AI will highlight quarterly performance and identify patterns, such as declining sales in specific periods, and provide recommendations to address these trends.
These AI-generated insights help businesses go beyond simply observing data and give them the tools to take action and drive results.
Download Reports Instantly in PDF Format
One of the key advantages of Automa8e Sales Analytics Dashboard is the ability to instantly download detailed reports in PDF format. This feature is especially helpful for sharing insights with stakeholders, managers, or team members in a professional format.
With Automa8e, you can generate comprehensive, AI-driven reports with just a few clicks and download them instantly in PDF format. These reports include detailed sales breakdowns, customer analysis, and AI-generated insights, ensuring that everyone involved in decision-making has the most up-to-date information.
This not only saves time but also provides greater accuracy and professionalism in your reporting process, making it easier to present data during team meetings or share with external stakeholders
Common issues in Business Analytics and Automa8e Solutions
Before concluding, let’s revisit the issues businesses face with analytics and how Automa8e addresses each one:
Data Overload: Many businesses are overwhelmed by the sheer volume of data available. Without the right tools, it’s nearly impossible to make sense of it all.
- Automa8e Solution: Centralized data visualization, advanced filtering, and AI-powered insights help you focus on what matters most, turning data into actionable knowledge.
Lack of Granular Insights: Even when businesses have access to data, they often struggle to get detailed, meaningful insights that can drive strategy.
- Automa8e Solution: The detailed breakdown of sales by customer, item, location, and quarter gives businesses the granular insights they need to fine-tune strategies and make data-driven decisions.
Time-Consuming Reporting: Compiling reports manually can be a time-consuming and error-prone process, often resulting in outdated data.
- Automa8e Solution: Automa8e allows you to generate AI-driven insights and reports instantly, saving time and ensuring you have access to up-to-date, accurate information.
Reactive Decision-Making: Without predictive insights, businesses are often forced to react to changes rather than plan for them.
- Automa8e Solution: With AI-powered predictions, Automa8e helps businesses anticipate customer behavior, identify trends early, and make proactive decisions.
Missed Opportunities for Growth: Many businesses don’t fully leverage their data, missing out on opportunities to grow revenue or optimize their operations.
- Automa8e Solution: Automa8e’s actionable recommendations provide businesses with clear next steps to re-engage customers, optimize product offerings, and improve sales performance across all metrics.
Transform Your Business with Automa8e AI-Powered Sales Analytics Dashboard
In a world where data drives success, having the right tools is essential for making smarter business decisions. Automa8e Sales Analytics Dashboard offers more than just sales reporting—it provides actionable insights powered by AI that help you turn data into growth strategies.
With features like advanced filtering, detailed sales breakdowns, AI-generated insights, and instant downloadable PDF reports, Automa8e transforms the way businesses analyze their sales data. Whether you’re looking to optimize customer engagement, refine your product offerings, or improve your sales performance across different regions, Automa8e has the solution.
Take control of your data today with Automa8e AI-Powered Sales Analytics Dashboard and unlock the potential of your sales insights. Start making smarter, data-driven decisions and drive your business toward long-term success.